Your brand in the media:
where and how much
Marketing and brand teams follow their brand, its products and their competitors across news sites and public Telegram channels. You list the names; MediaMonitor finds the publications, folds reprints into stories and keeps the counts current.
When the brand is an ordinary word
The search cannot tell a brand from the common word it shares a name with: there is no automatic homonym detection, so you cut the noise yourself. All of these keeps only publications that also contain your context words, such as the product category. None of these drops publications with words that belong to the other meaning.
One line per spelling: Cyrillic, Latin, transliterated and abbreviated names are separate words.
Both are trade-offs. A context word in All of these also drops real mentions that leave it out. Case sensitive keeps the capitalised name and skips the lowercase word, but it no longer finds the other forms of the name and still catches the word at the start of a sentence. Read the first results and adjust the query.
How queries are writtenA baseline before day one
You do not start from an empty screen. When a query is saved, changed or switched back on, it also searches the archive, so the coverage before you started is visible at once, for your brand and for each competitor.
A project for each competitor
Set up each competitor the way you set up your own brand: a separate project with its names and spellings. Its queries search the archive too, the dashboard filter switches between projects, and an export can take one project or several.
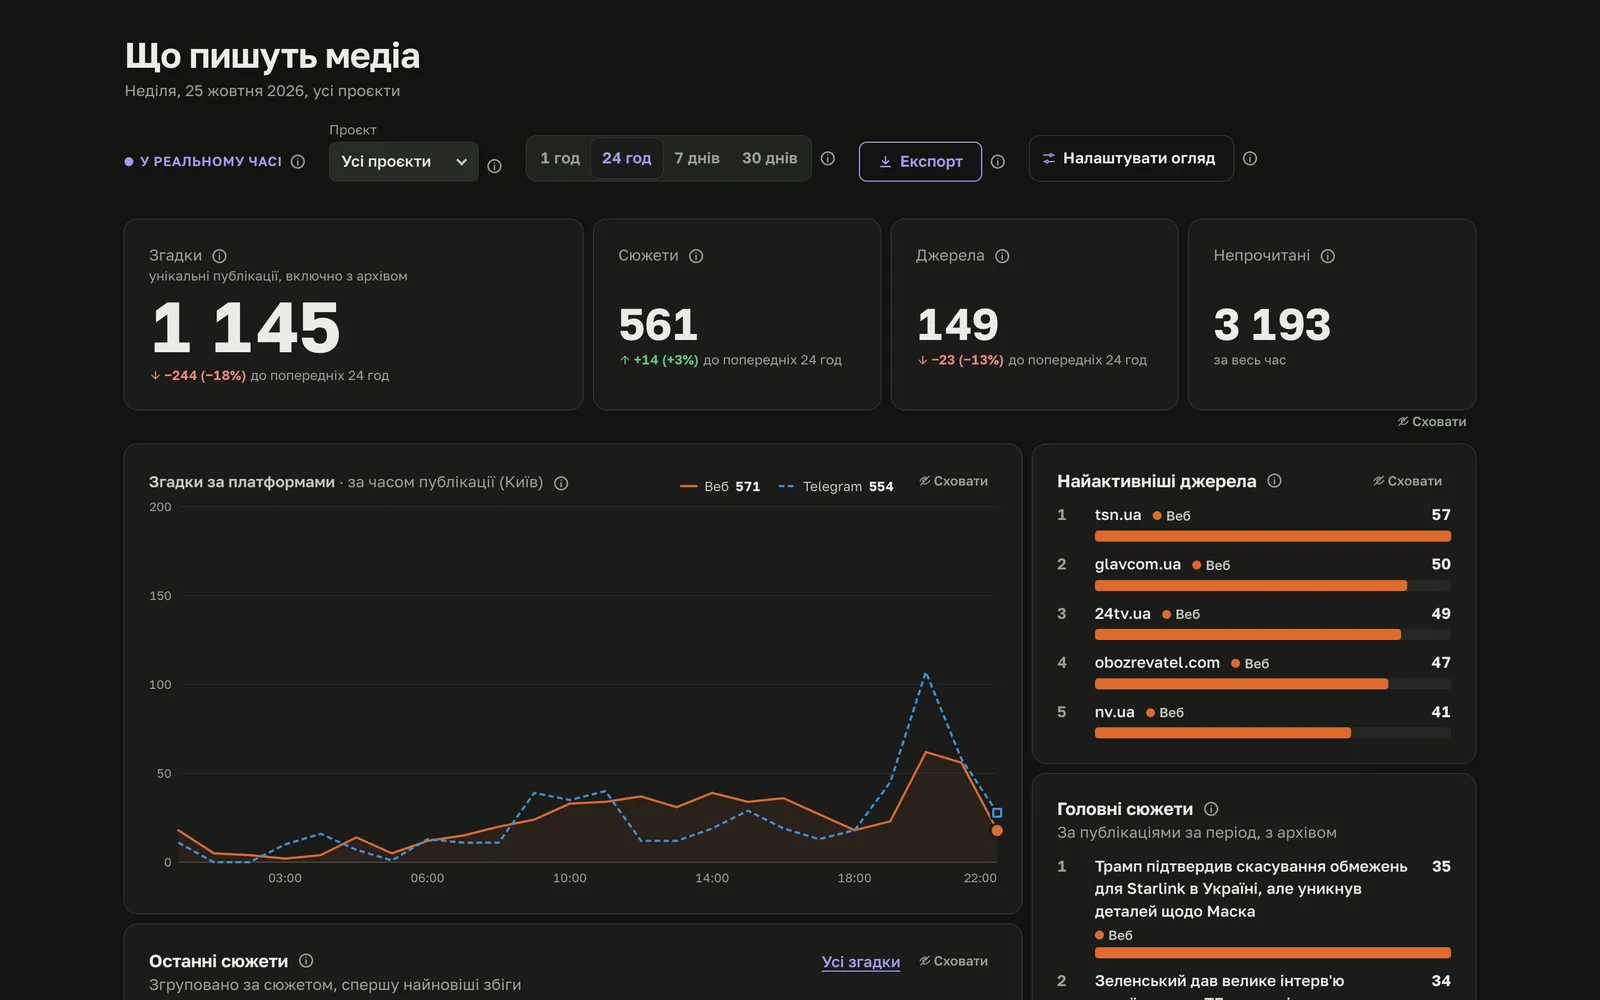
Switch the project filter from your brand to a competitor and keep the period: the chart shows its volume over the same days, web and Telegram as two lines.
Up to 50 projects in a workspace and up to 100 queries in each.
How coverage moves
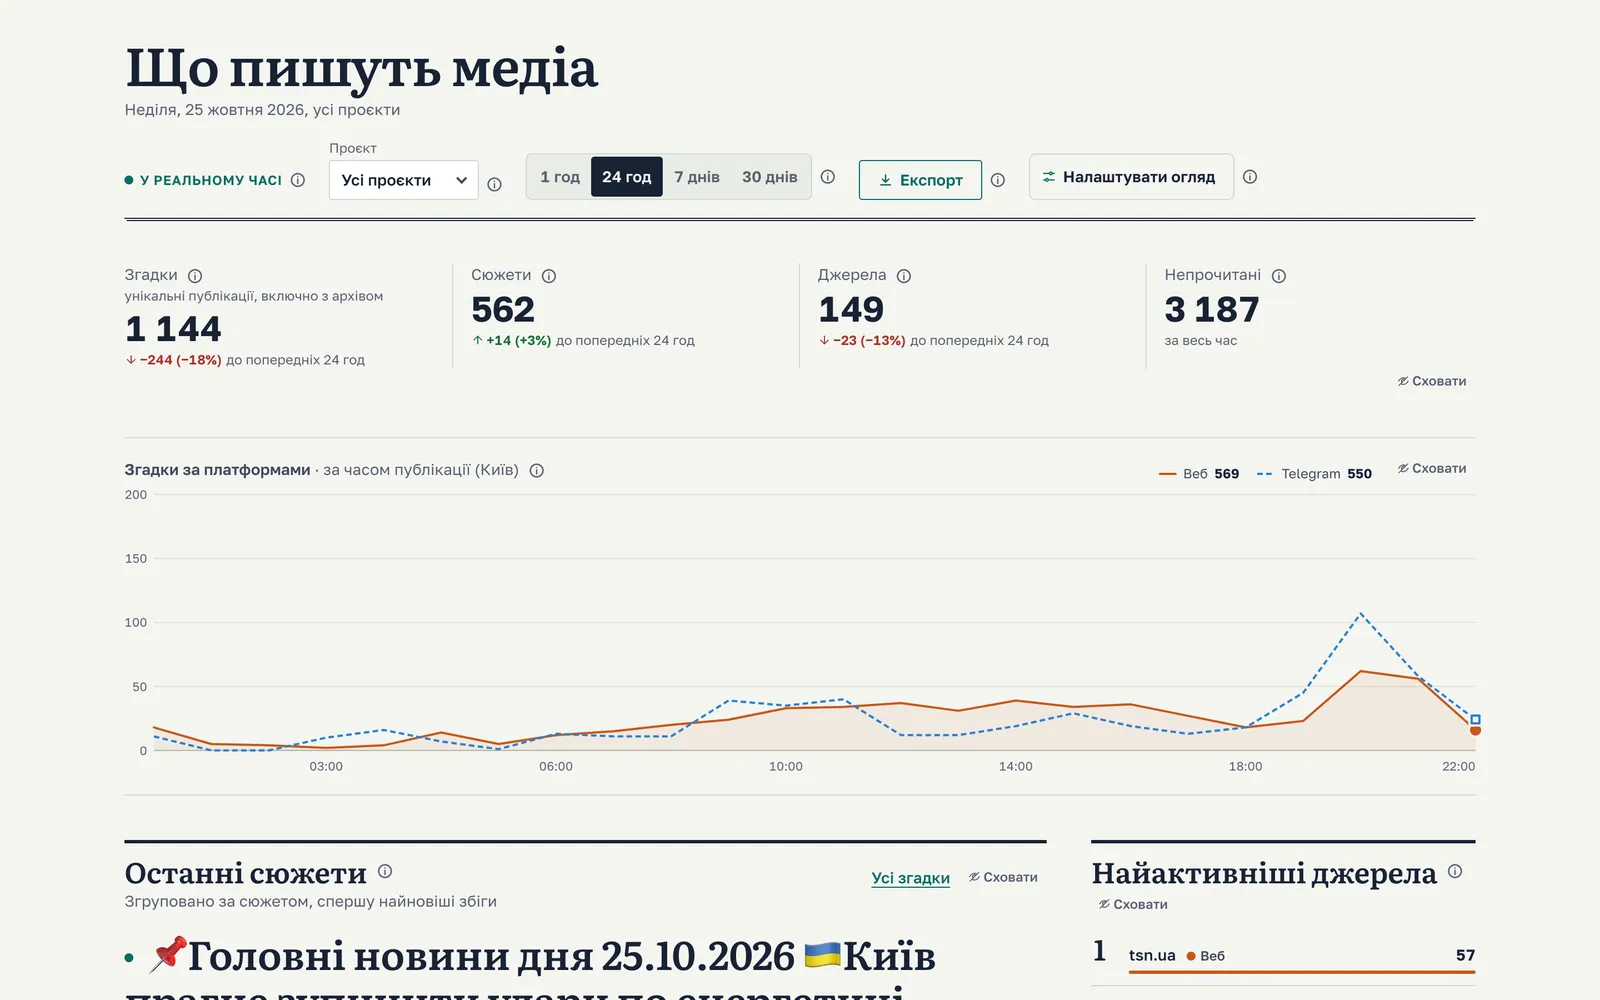
The dashboard counts what your queries found: mentions, stories and sources for the period, each against the previous period of the same length. The chart draws web and Telegram as two lines, so you see when coverage rose and whether news sites or Telegram channels carried it.
- Web and Telegram over 1 hour, 24 hours, 7 or 30 days, refreshed live.
- The five busiest sources and the five largest stories of the period, archive finds included.
- The latest stories, one row each, with the number of other publications about the same event.
- Active queries with no new mention for 7 days, so a product nobody writes about, or a query that misses, stands out.
Counts, not opinions
The numbers are counts of publications, stories and sources. MediaMonitor does not score tone, share of voice or audience reach. Labels such as Important or Irrelevant help the team sort mentions but do not change the counts: to take noise out of the numbers, tighten the query.
From the dashboard to the people who need it
Alerts go by e-mail or Telegram and cover every project, competitors included; an Excel export and signed webhooks take the data further.
Start with your brand
Create an account, add a project for your brand and see what the archive already holds about it.
Create an account